


Haplo

Haplo AI Investing

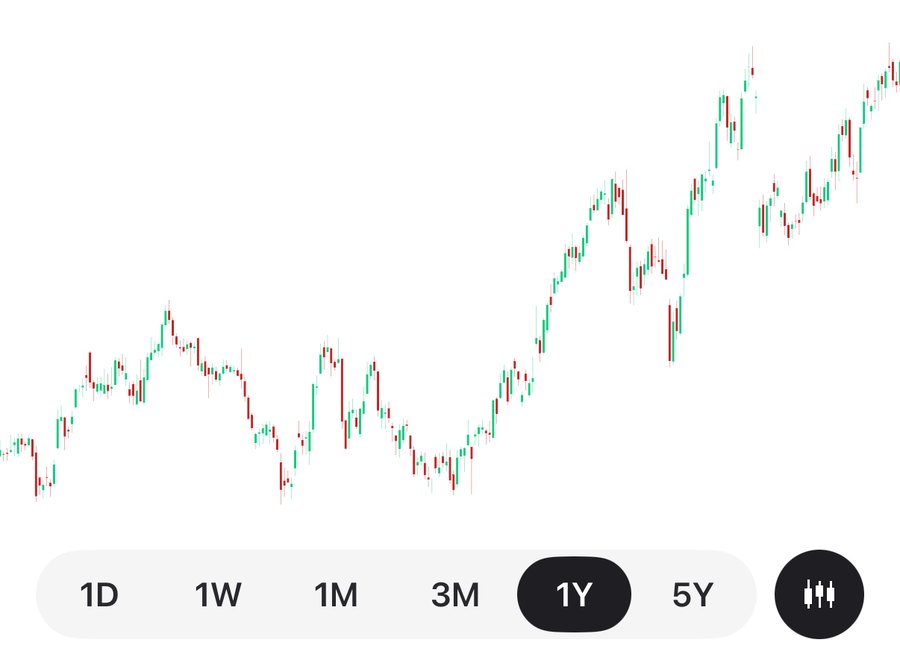
Haplo AI Investing's candlestick chart of Apple (AAPL): a year of daily candles, September 2025 to September 2026, with the 1D to 5Y range picker underneath

Stock market AI for iPhone

Haplo’s AI reads a stock’s trend, momentum and volatility from its price history, tells you what each signal means in plain English, then scores the whole setup from 0 to 100 and shows every part.

4.5 · 64 App Store ratings

Tool 1 of 5, the AI reads the trend

Trend

The first thing the AI looks at is the trend. Switch on SMA 50 and SMA 200 and the app draws Apple's average close over the last 50 and 200 days, then circles the moments that matter: on September 15, 2025, the 50-day crossed above the 200-day, and the app named it.

The app's read for Sep 15, 2025

SMA 50 $221.59 Bullish

SMA 50 crossed above SMA 200, the classic golden cross, a long-term bullish sign.

The average close of the last 50 bars, the medium-term trend line many traders watch.

Indicator read · educational · not investment advice

Crosses come late by design. The death cross landed on April 7, 2025, a day before the low, and the golden cross 109 sessions and a 37% climb later. Golden and death crosses, explained

Apple (AAPL) daily prices from Nasdaq, January 2, 2025 to September 25, 2026. Past prices, for illustration.

Tool 2 of 5, momentum

Momentum

RSI 14 sets the average gain of the last 14 days against the average loss, smoothed Wilder's way, on a 0 to 100 scale. Above 70 the app calls a stock overbought, below 30 oversold. On May 28, 2026, Apple's RSI reached 79.8, the highest on this chart.

The app's read for May 28, 2026

RSI 79.8 Bearish

RSI 80 is overbought, the rally looks stretched and often pauses from here.

Momentum on a 0-100 scale. Above 70 is overbought, below 30 is oversold.

Indicator read · educational · not investment advice

A read, not a forecast: RSI stayed above 70 for 15 sessions in May while the price climbed from $293.32 to $312.06. In January it fell to 17.9, oversold. RSI, explained

Tool 3 of 5, volatility

Volatility

Bollinger Bands (20, 2) sit two standard deviations either side of the 20-day average, so they widen when the price swings and pinch when it goes quiet. They were 22.5% wide on July 21, 2026, and 4.9% on August 27, the narrowest since January.

The app's read for Aug 27, 2026

Bollinger 4.9% wide Neutral

Price is inside the bands, volatility is not at an extreme. The bands are also tightening, a bigger move often follows a squeeze.

Volatility bands around a 20-bar average. Price at the outer bands flags a stretched move.

Indicator read · educational · not investment advice

Bollinger Bands and the squeeze, explained

Tool 4 of 5, MACD

MACD

MACD (12, 26, 9) takes the 26-day exponential average from the 12-day one, then draws a 9-day average of the result as its signal line. The bars are the gap between the two. On August 26, 2026, the MACD line crossed above its signal line.

The app's read for Sep 3, 2026

MACD +2.03 Bullish

MACD is above its signal line, and the gap is widening, momentum favors buyers.

Two moving averages compared. The line crossing its signal flags momentum shifts.

Indicator read · educational · not investment advice

MACD, explained

Tool 5 of 5, the setup score

Setup score

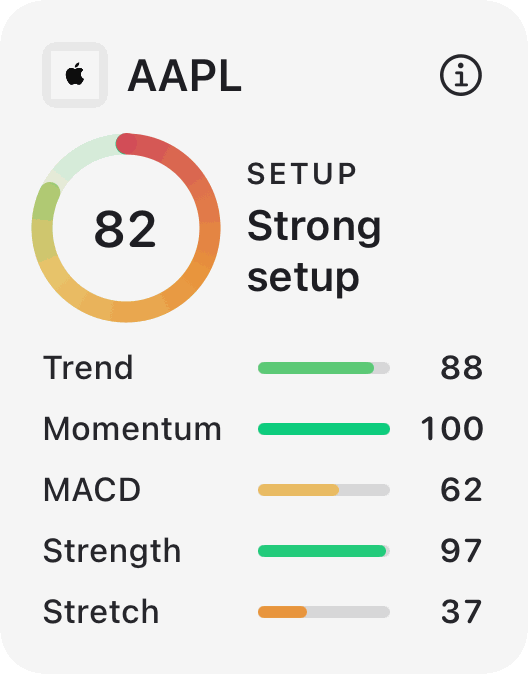
On September 25, 2026, the app scored Apple 82 out of 100: a strong setup. It blends five parts of the daily closes and shows every one, so you can see what is carrying it. You have just met four of them.

  1. Trend the price and its 20-day average against the 50-day 88 × 30%
  2. Momentum RSI 14, scored highest from 62 to 70 100 × 25%
  3. MACD the gap to its signal line, against a typical day’s move 62 × 20%
  4. Strength where the price sits in its yearly range 97 × 15%
  5. Stretch where the close sits in its Bollinger Bands 37 × 10%

88 × 0.30 + 100 × 0.25 + 62 × 0.20 + 97 × 0.15 + 37 × 0.10 = 82.05, shown as 82

Haplo AI Investing's setup card for Apple (AAPL): a score of 82 in a ring, labelled Strong setup, with Trend 88, Momentum 100, MACD 62, Strength 97 and Stretch 37
The part scores come from the app's own card for Apple on September 25, 2026. Two of them can be checked against this chart: RSI closed the day at 65.7, inside the 62 to 70 band that scores a full 100, and the close sat 0.86 of the way up its bands, which scores 37.

A score describes the chart; it does not call the next move. Can AI predict the stock market? New to charts? How to read a stock chart.

The technicals, scored and shown

Models read the price history and hand back a score with every component broken out, so you can see what is carrying it, and disagree.

See the setup before you commit

Trend, momentum, MACD, stretch and where the price sits in its yearly range, read off the daily closes and blended into one score. Every part is shown, so you can see what is carrying it.

Charts you can actually read

Candlestick, line, bar and pie, with the indicators you expect and a plain-English read of each one. Quotes refresh about once a minute while the market is open.

What the models read

Eight Core ML models, bundled with the app and run on your phone, reading price and volume history.

Where the street sits

Analyst ratings summarised beside the model, so you can see when they disagree.

Headlines worth your time

The day’s coverage ranked by how reputable and how recent the source is, so the forty articles become the few worth opening.

Check how the calls held up

Every prediction is kept and scored against what actually happened, so the model’s record is something you can inspect rather than take on trust.

A research tool, not a crystal ball

Next-day direction is close to a coin flip, and the app says so where it shows it. The scores are for weighing a setup, not for being told what happens tomorrow, and none of it is personalised advice.

What people say

Unedited, from the App Store.

“i’m just a beginner but this app is so simple for me to use!”

am.te.za.

“I referred all my fellow single black fathers to download this app”

EminemJeezyLinkinPark

“This app runs perfectly. Definitely the best and smoothest in its field.”

$&@"-@;2829;

“This is a great app to use to help me make smart investing decisions. Highly recommend!”

Me2books1

“A necessity if you're trading nowadays. Super user friendly which is why I won't ever stop using it!”

Thebeasteguy27

“This is a great app for anyone looking to learn more about stocks. The app is easy to navigate and has lots of learning opportunities”

Biblefordailyreading

See the setup first.

Plain-English reads of every indicator, a 0 to 100 setup score with each part shown, and models that run on your iPhone. $4.99 a month or $44.99 a year, or $259.99 once and keep it.

Haplo AI Investing

Stock research for iPhone

4.5 64 App Store ratings

  • iPhone
  • $4.99/mo
  • Models run on your phone
Download on the App Store

App information

Version5.6
Updated2026-11-06
Size35MB
CompatibilityiPhone
Price$4.99/mo